Key PPC Metrics: CTR, CPC, CPA, ROAS
1. CTR (Click-Through Rate)
- Formula: (Clicks ÷ Impressions) × 100
- Indicates how often people click your ad after seeing it.
- High CTR means your ad is relevant and engaging.
Why It Matters: A high CTR can improve your Quality Score, lower your CPC, and increase your Ad Rank. For a deeper dive, see our Introduction to PPC.
2. CPC (Cost Per Click)
- Formula: Total Cost ÷ Total Clicks
- Shows how much you pay every time someone clicks your ad.
- Influenced by competition, bidding strategy, and Ad Rank.
Why It Matters: Lower CPC means more clicks for your budget, helping control ad spend effectively. For more on bidding strategies, check our Google Ads Essentials course.
3. CPA (Cost Per Acquisition)
- Formula: Total Cost ÷ Total Conversions
- Reveals how much you’re paying per sale, lead, or signup.
- Crucial for performance-focused campaigns.
Why It Matters: Helps assess whether your campaign is cost-efficient in driving real results. Learn more in Goals and Conversion Tracking.
4. ROAS (Return on Ad Spend)
- Formula: Revenue ÷ Cost of Ads
- Measures how much revenue you earn for every dollar spent on ads.
- For example, ROAS of 5 means $5 return for every $1 spent.
Why It Matters: Especially important in ecommerce, ROAS guides decisions around profitability and scaling.
Pro Tip: Monitor all these metrics together. High CTR but low conversions may indicate weak landing pages, while low CTR with high ROAS can still be profitable.
A/B Testing Ads and Landing Pages
What is A/B Testing?
A/B testing, or split testing, compares two versions of an ad or landing page to see which performs better across metrics like CTR, conversion rate, CPA, or ROAS. This approach is introduced in our Introduction to PPC course.
Why A/B Test?
- Refine ad headlines and boost CTR
- Optimize offers or layouts to increase conversions
- Reduce your CPA or CPC over time
- Base decisions on data, not guesswork
Ad Testing Ideas
- Headlines: Try different CTAs or angles
- Descriptions: Change tone or highlight benefits
- Display Paths: Add keywords or categories
- CTAs: “Buy Now” vs. “Start Free Trial”
- Ad Extensions: Try various sitelinks or callouts
How to Run A/B Tests
Responsive Search Ads (RSAs):
- Add multiple headlines and descriptions
- Google auto-tests combinations
Manual Testing:
- Create 2–3 variations in a single ad group
- Monitor performance with equal budget
What to Measure:
- CTR, Conversion Rate, Quality Score, CPA, ROAS
Tip: Let your test run for at least two weeks with sufficient clicks before declaring a winner. For more on testing and optimization, see our Google Ads Essentials course.
Landing Page Testing
What to Test:
- Headline (tone, clarity, keyword)
- CTA (button color, placement, wording)
- Images or videos
- Form length
- Page structure and layout
- Offer type (discount, free trial)
Testing Tools:
- Unbounce, Instapage, Webflow
- Google Ads Experiments
Key Metrics:
- Conversion Rate
- Bounce Rate
- Time on Site
- Page Load Speed
Best A/B Testing Practices
- Test one element at a time
- Collect enough data (100–300 clicks)
- Run tests across different days/times
- Keep track of learnings and wins
Budget Optimization
What is Budget Optimization?
It’s the process of allocating ad spend to maximize ROI by boosting top performers, cutting waste, and meeting campaign goals effectively. This approach is covered in our Google Ads Essentials course.
Key Tactics
- Set Clear Goals: Choose whether to focus on clicks, conversions, revenue, or impressions
- Structure Campaigns: Organize by product, goal, or audience
- Use Shared Budgets: Let Google distribute based on performance
- Prioritize Performers: Shift budget to top campaigns and cut low ROI ones
- Use Ad Scheduling: Focus budget on high-converting times
- Geo Targeting: Invest more in top-performing regions
- Leverage Smart Bidding: Use if you have sufficient conversion data
- Monitor Limits: Avoid capping budgets on winning campaigns
- Test and Reinvent: A/B test, then reinvest in what works
Summary Table
| Strategy | Purpose |
|---|---|
| Set Clear Goals | Know what you’re optimizing for |
| Review Performance | Spot top and low performers |
| Shift Budgets | Reallocate based on ROI |
| Smart Bidding | Automate using conversion data |
| Geo/Time Optimization | Spend when and where it counts |
| Avoid Budget Caps | Unleash full campaign potential |
Performance Reporting & Insights
Why Reporting Matters
- Track progress toward campaign goals
- Spot opportunities and weak points
- Guide optimization and budget decisions
Key Metrics
- CTR, CPC, CPA, ROAS
- Conversion Rate
- Bounce Rate, Time on Site, Pages/Session
Top Reports
- Google Ads Overview: By campaign, keyword, device, etc.
- Google Analytics: Track post-click behavior and conversions
- Search Terms: See what queries triggered your ads
- Auction Insights: Compare against competitors
- Custom Dashboards: Visual reporting via Looker Studio, as taught in Analytics and Optimization.
Actionable Tips
- Segment data (device, time, location)
- Compare time periods (WoW, MoM, YoY)
- Identify and scale high-ROAS campaigns
- Automate reports weekly or monthly
Summary Checklist
| Task | Purpose |
|---|---|
| Monitor Key Metrics | Track clicks, costs, and returns |
| Segment Reports | Uncover patterns and insights |
| Measure Conversions | Ensure real ROI |
| Use Dashboards | Visualize and share data easily |
| Act on Data | Make informed optimizations |
Recommended PPC Courses:
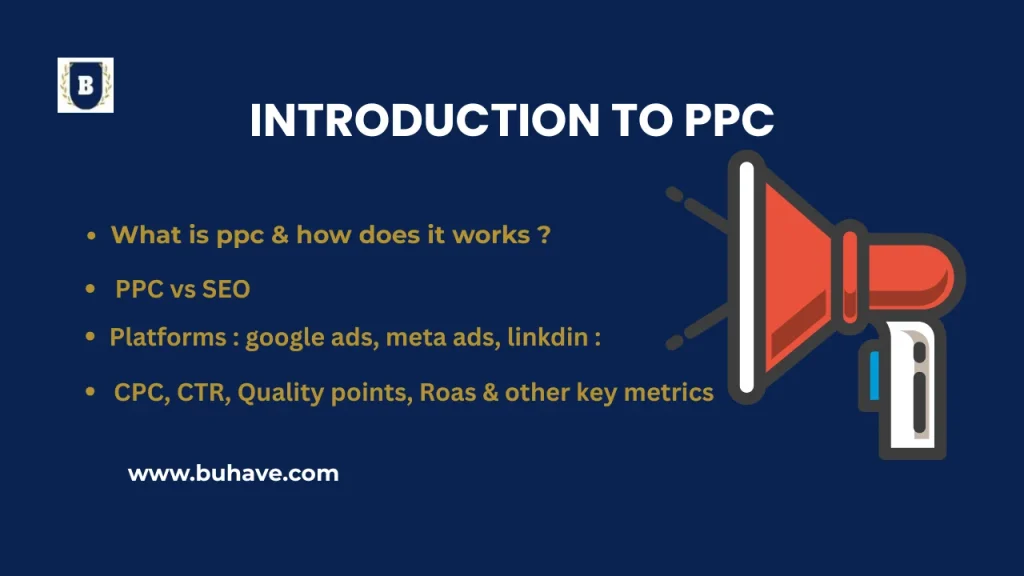
- Introduction to PPC
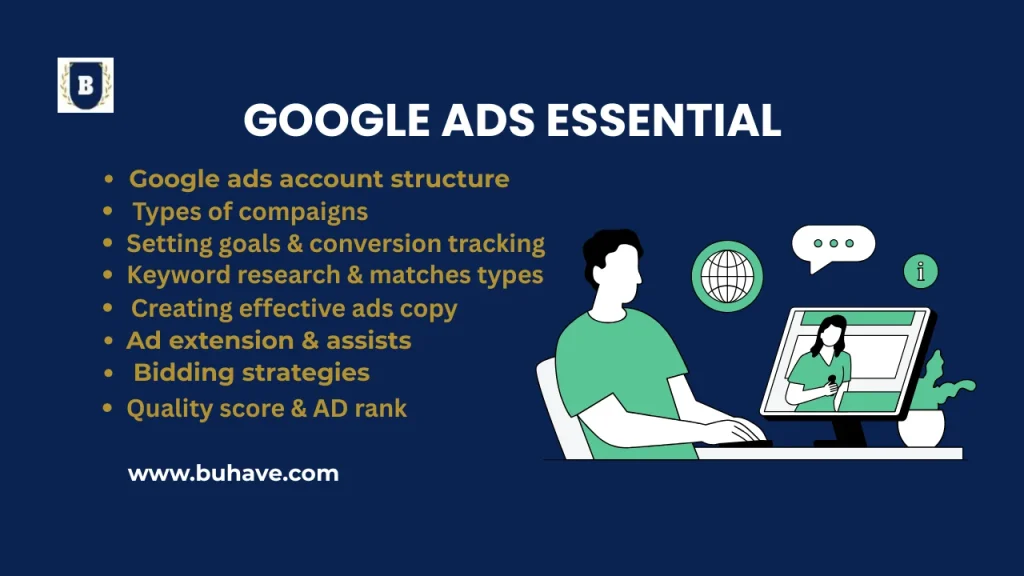
- Google Ads Essentials
- Keyword Research
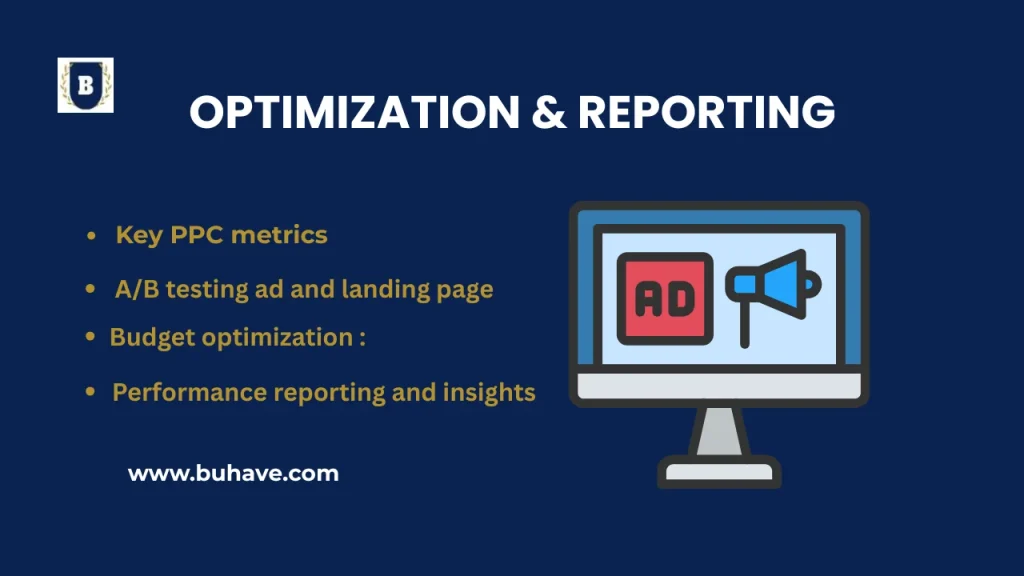
- Optimization & Reporting
- Quality Score & Ad Rank
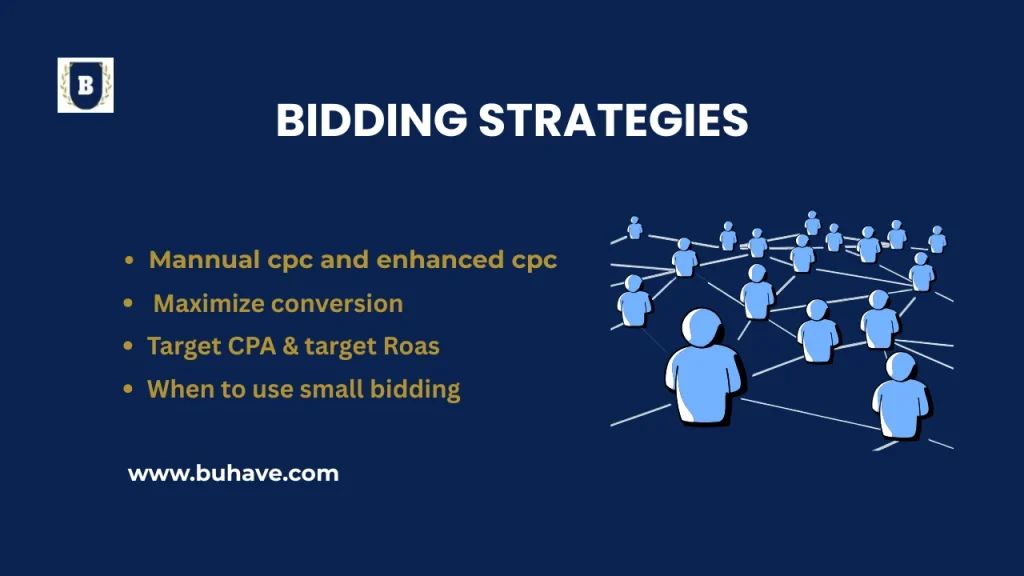
- Bidding Strategies
- Creating Effective Ads
- Conversion Tracking
- Meta Ads (Facebook & Instagram)
Staying on top of these metrics helps you optimize campaigns in real time and build a data-driven roadmap. To deepen your understanding, explore our courses like Google Ads Essentials and Goals and Conversion Tracking.